Statistics
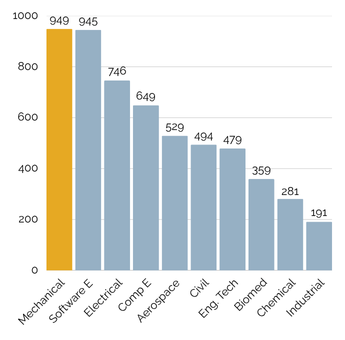
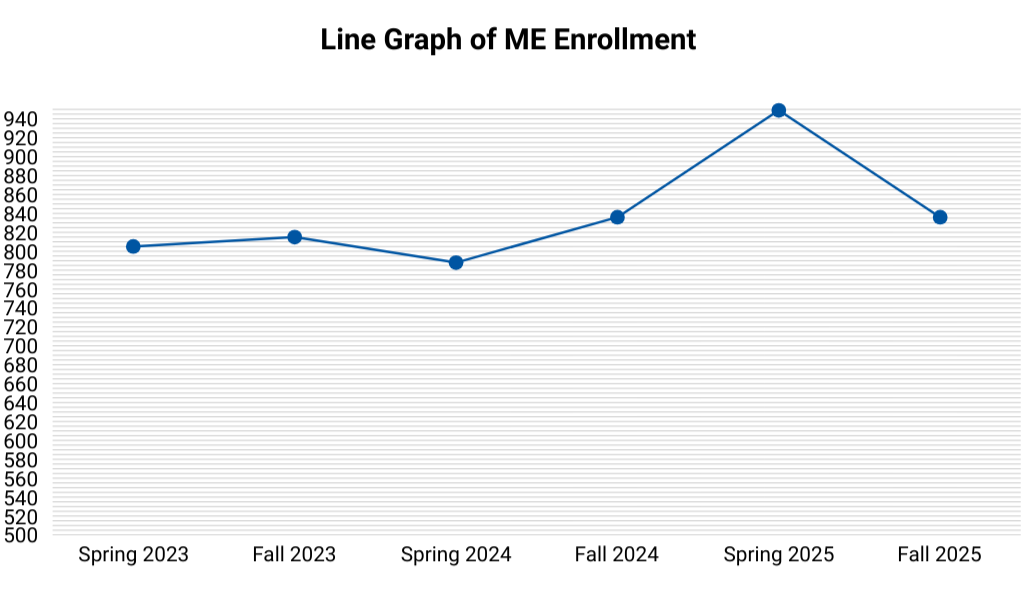
College of Engineering Enrollment Rate as of Spring 2025
Overall rates of entering cohorts, including first-time freshman, new undergraduate transfers, and first-time graduate students.
| Fall 2025 |
836 |
| Spring 2025 |
949 |
| Fall 2024 |
836 |
| Spring 2024 |
788 |
| Fall 2023 |
815 |
| Spring 2023 |
805 |
| Year | Cohort Size | 4 yr. grad rate | 5 yr. grad rate | 6 yr. grad rate |
|---|---|---|---|---|
| 2016 |
65 |
23.1% |
64.6% |
76.9% |
| 2017 |
93 |
21.5% |
66.7% |
74.2% |
| 2018 |
70 |
47.1% |
75.7% |
82.9% |
| 2019 |
93 |
20.4% |
55.0% |
- |
| 2020 |
149 |
24.8% |
- |
- |
| 2021 |
126 |
- |
- |
- |

